The Price is Right: How to use the price sensitivity meter to determine product value
October 2, 2024

Here’s a common conundrum: say you have a product that you’re trying to sell — a milk chocolate bar, for instance — and you want to sell it at a price that will make it an attractive option to the general public. How would you go about determining that price?
In 1976, Dutch economist Peter Van Westendorp unveiled his Price Sensitivity Meter (PSM) to do just that, and in the following decades, it has become a common tool in the market researcher’s arsenal for determining consumer price preferences.
To collect the necessary data for the PSM, four price-related questions are posed to all respondents. In each of these questions, respondents are asked to name a price that they would expect the product to cost, based on different conditions.
The four questions typically are as follows:
- At what price would you consider this product to be priced so low that you are skeptical of the quality of the product?
- At what price would you consider this product to be a bargain or promotion — a great buy for the money?
- At what price would you consider this product to be starting to get expensive — it’s not out of the question, but you’d have to give some thought to buying it?
- At what price would you consider this product to be so expensive that you would not consider buying it?
The results from these four questions will eventually be plotted as four cumulative distributions, representing the product priced too cheaply, at a bargain, too expensive, or much too expensive, respectively.
Getting this data into a workable state will require some transformations. An important first step is to determine the distribution of each price point, making sure to eliminate any outliers — $1,000,000 is not too cheap for a chocolate bar no matter how rich you are.
Next, each instance of every dollar amount entered is counted for each level — for instance, the chocolate bar could have been seen as too cheap at $1.00 100 times, but considered a bargain at that same price 15 times.
Finally, for the too cheap and bargain values, the percentage of respondents who believe each price point meets those values is calculated, with the lowest prices comprising 100% of respondents and decreasing every step. The same calculation is applied to the expensive and too expensive values as well, except reversed so that the most expensive price points account for 100% of respondents.
From there you can graph out each of your values, and produce a plot that should look something like this:
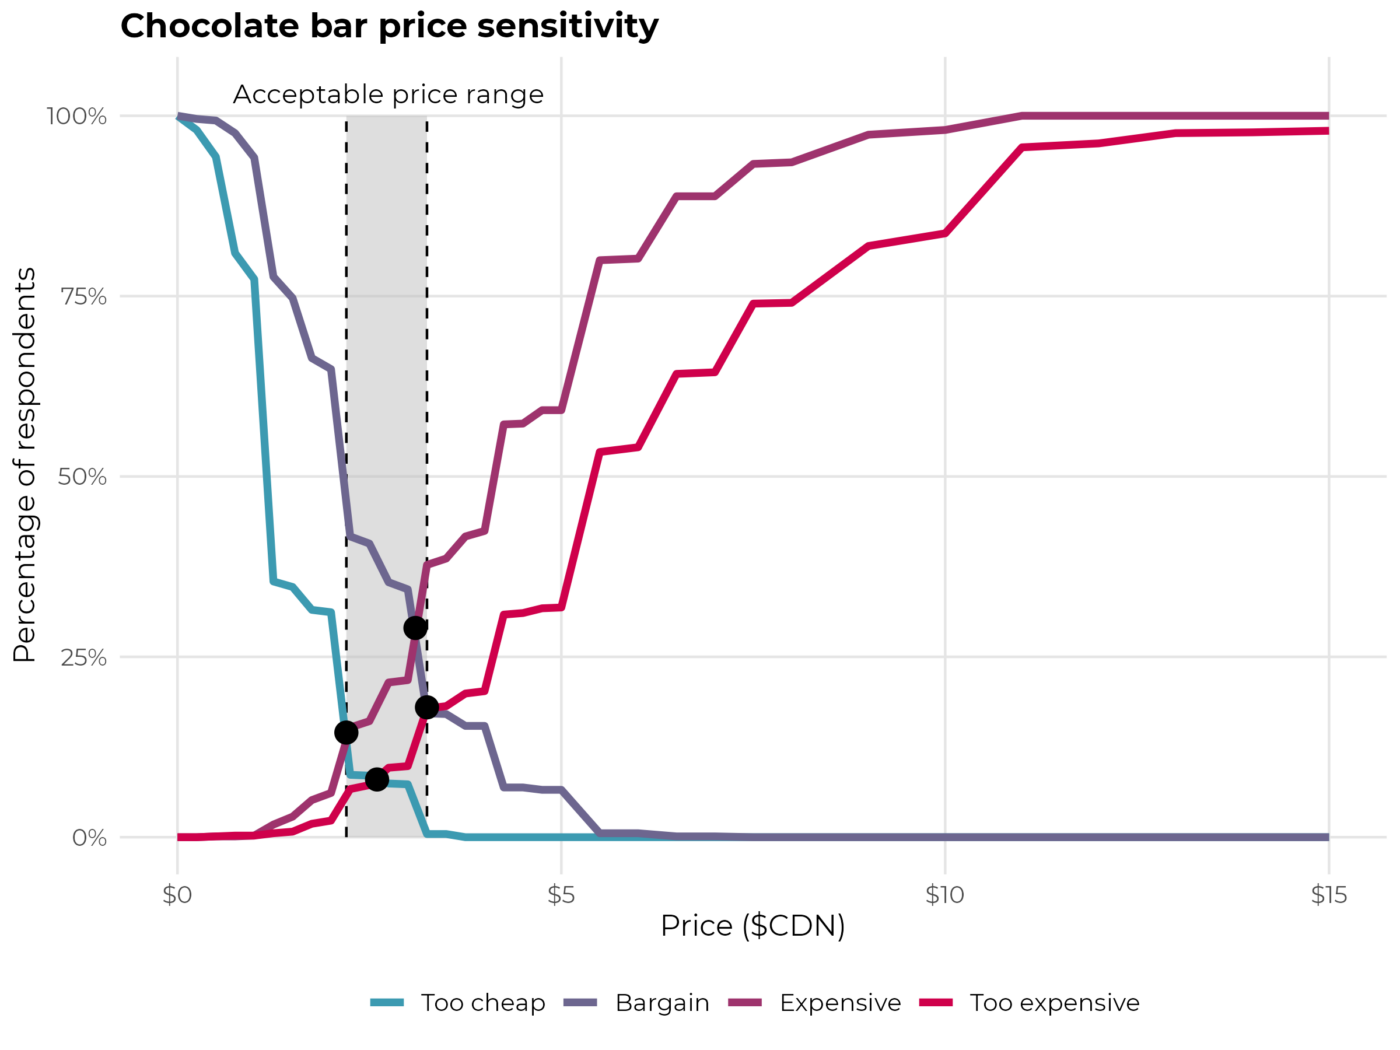
Here we have the four values of our chocolate bar – too cheap, bargain, expensive, and too expensive – plotted on our graph. Our primary points of interest are the places in which two of the lines intersect, and the space between them on the x-axis.
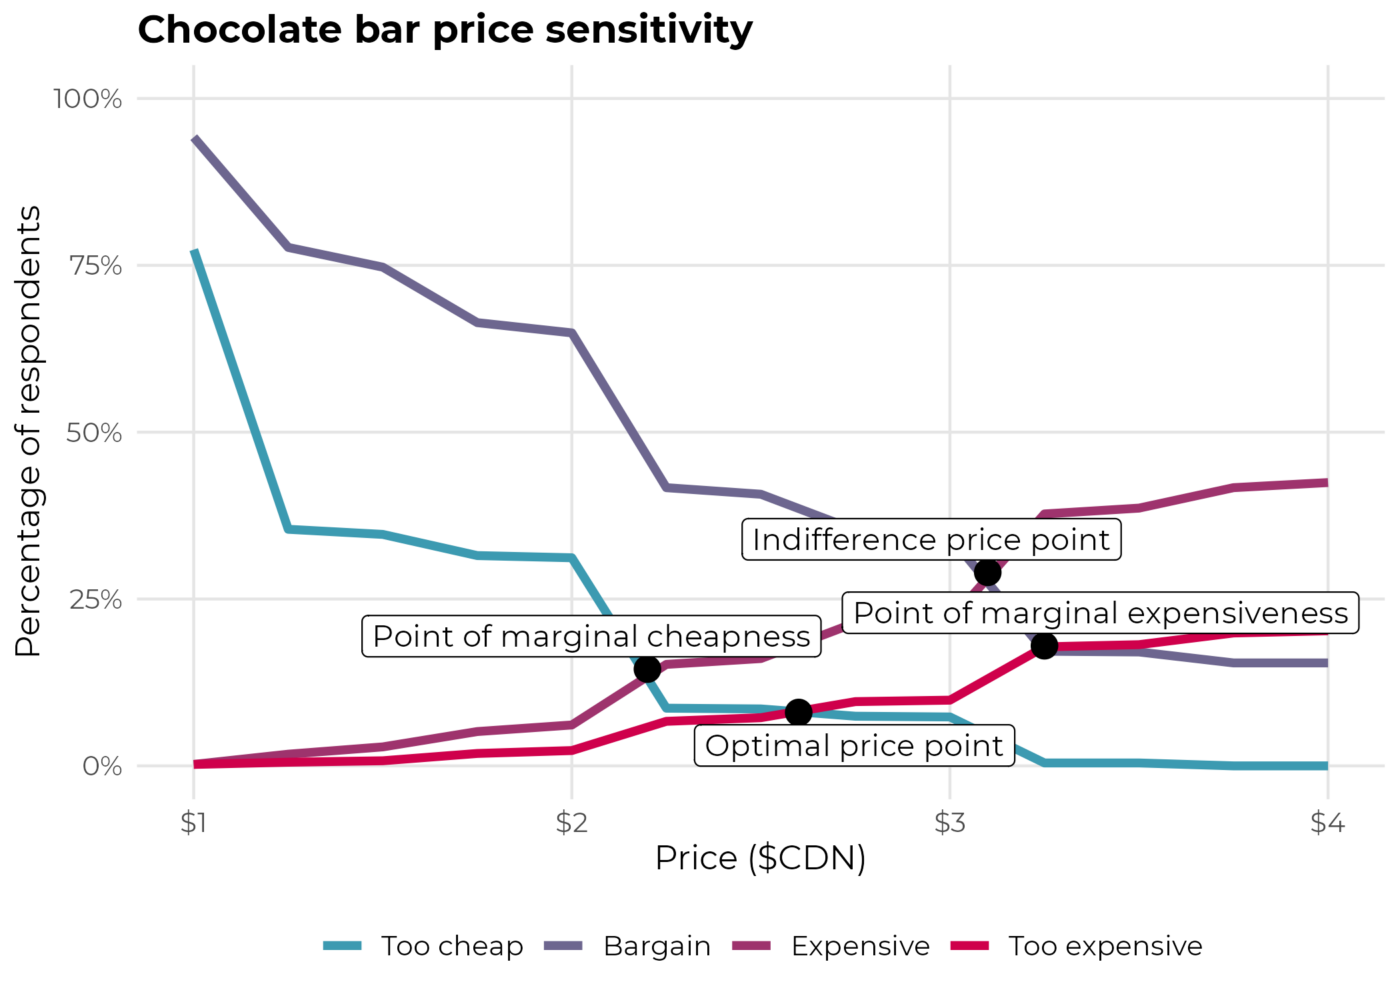
These four points of intersection each tell us different things about what the public thinks a bar of chocolate should cost. The intersection between too cheap and expensive and the intersection between a bargain and too expensive are known as “the point of marginal cheapness” and “the point of marginal expensiveness”, respectively. These represent the lower and upper bounds of what the public might consider an acceptable price for a bar of chocolate, which in this case ranges from about $2.20 to around $3.25.
The upper point, at the intersection between a bargain and expensive, is “the indifference price point”. This represents the price with the maximum number of respondents who would consider the product to have good value while still being expensive – about $3.10 in this case. The final intersection is the one between too cheap and too expensive. This is known as “the optimal price point”, where the number of respondents who would consider buying this product is at its maximum. For this bar of chocolate, it equals approximately $2.60.
The PSM can also be used to analyze the pricing perceptions of different product descriptors. For instance, a chocolate bar could also be considered “organic” or “fair trade-certified”, which might change a respondent’s idea of how much it might cost.
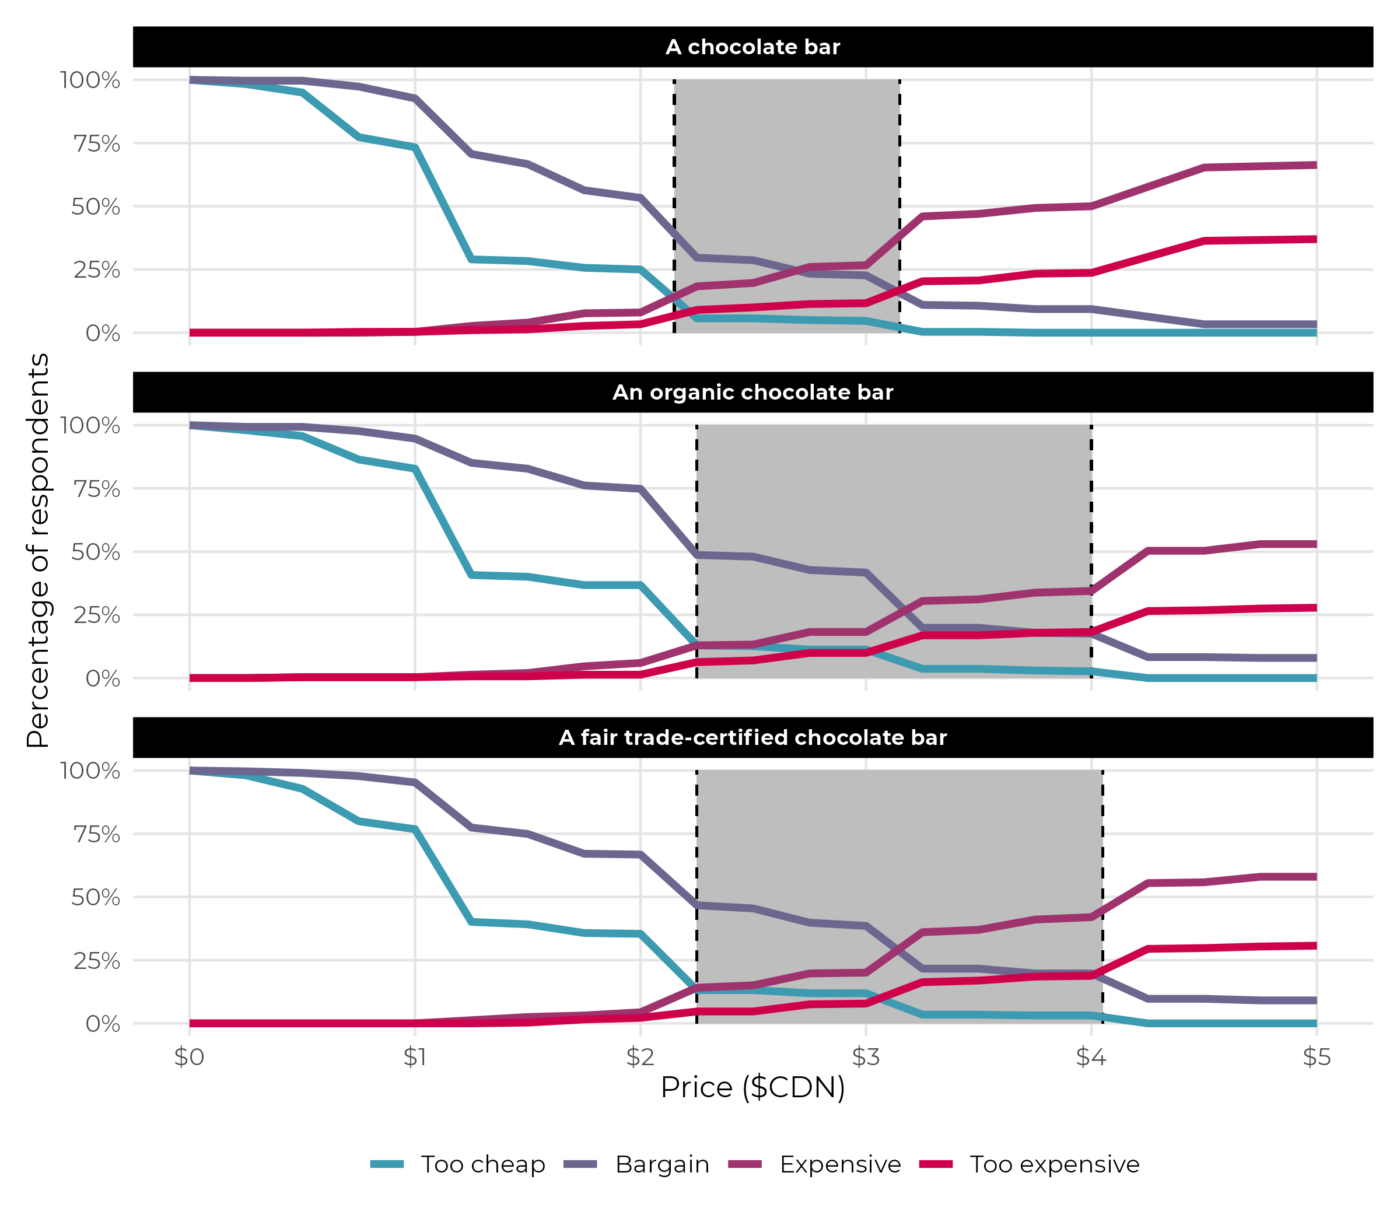
As we can see, adding descriptors can change the public’s perception of how much a product should cost. Here we can observe that the regular chocolate bar has an optimal price point around $2.25, and an acceptable price range of approximately $2.10 to $3.15. Meanwhile, the fair trade-certified chocolate bar and the organic chocolate bar have optimal price points over $3.00, with a price range of between $2.25 and $4.00.
Overall, the PSM is an intuitive tool that can provide valuable insight into the perceived value of your product. Of course, this tool is not limited to chocolate bars — it can be applied to any product or service that is priced. For this reason, the DS Insights team will often use the PSM as a valuable addition to market research studies.
About the authors
When I was a magazine editor, my educational background in geographic information systems and my need to constantly shove data and graphs into my articles eventually led me to working at Data Sciences as a Research Analyst. Now I use my passion for data storytelling to provide valuable insight for our clients or to attempt to convince my coworkers to watch basketball.